
Page Management
Analytics
3 min read
Activate Analytics with Foxify
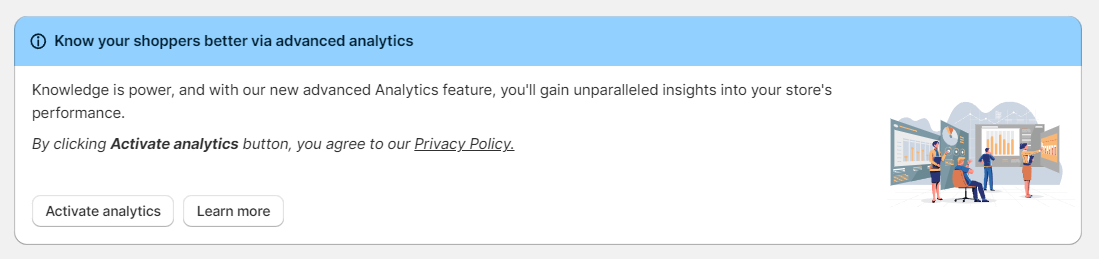
By clicking the Activate analytics button, you agree to our Privacy Policy.
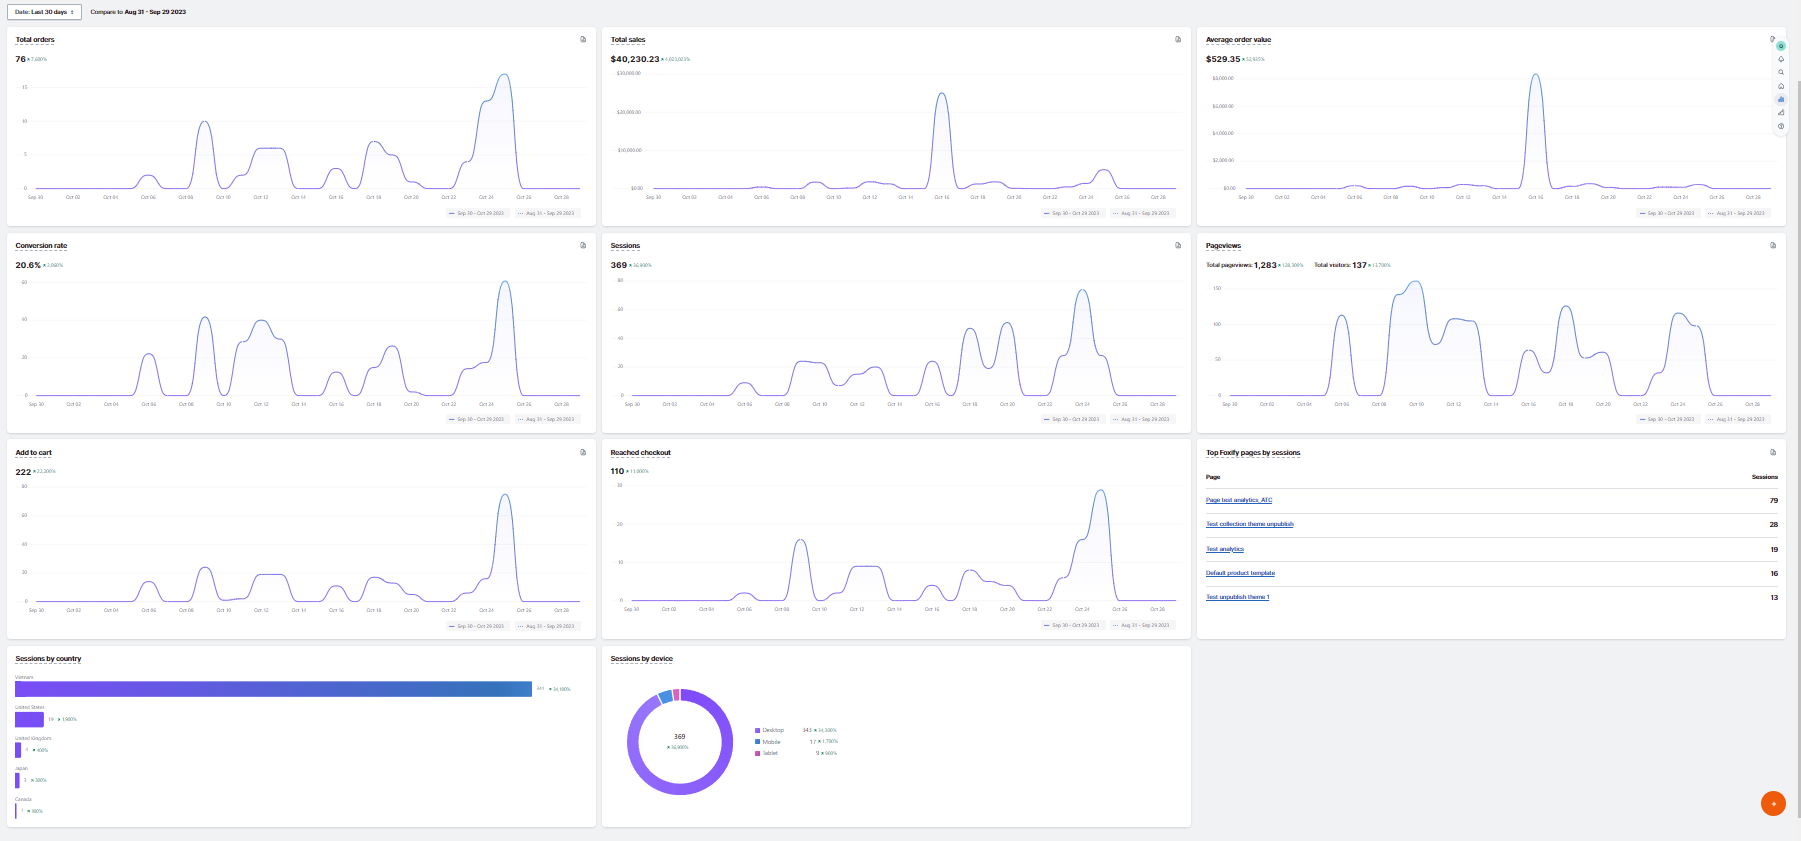
Key metrics of Foxify Analytics
| Metric | Description |
|---|---|
| Page views | Number of views on the Foxify page |
| Visitors | Number of visitors on the Foxify page |
| Sessions | Number of sessions on the Foxify page |
| Clicks | Number of times the shoppers click on any CTA or link on the Foxify page |
| Add to cart | Number of sessions in which shoppers added one or more items to their shopping carts on the Foxify page |
| Reached checkout | Number of sessions in which shoppers added one or more items to their shopping carts on the Foxify page, proceeded to the checkout, and performed an action |
| Total sales | Displays the sales amounts related to the Foxify Note: Foxify only has the ability to track sales from a Foxify Add to Cart button. If you are using an add to cart button from your theme or a third-party app that affects the add-to-cart process, this may not be tracked. |
| Total orders | Displays the number of orders related to the Foxify |
| Average order value (AOV) | Displays the average value of all orders, divided by the total number of orders from Foxify pages. |
| Conversion rate | Displays the percentage of sessions that lead to an order |
| Sessions by devices | Displays the number of sessions on your online store and what kind of device was used to access your store. The most common device types are mobile, desktop, and tablet. |
| Sessions by countries | Displays the number of sessions on your online store sorted by country. |
| Top Foxify pages by sessions | Displays the specific Foxify pages on which your customers started their sessions on your online store. A page is determined from the URL viewed in a unique session. |
Sessions and visitors
Last updated